Hands-On Activity:
M&M's with Percentages and Mean, Median, Mode
M&M's with Percentages and Mean, Median, Mode
Implementing hands on activities are important in a classroom. The students are able to see real life situations applied to their mathematical learning. This can help their understanding of the topic being focused on in the activity.
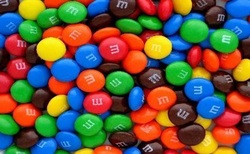
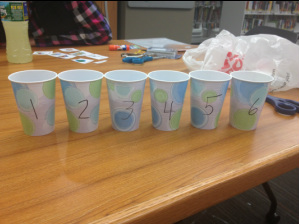
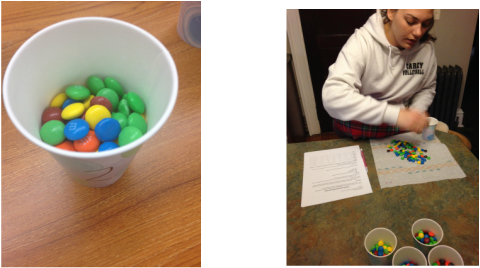
Specifically in my activity, I will have the students break down into groups and explore the percentages of each color featured in a bag of M&Ms. Each group will be provided with one cup containing approximately 100 M&M's. In their groups, the students will count the total number of each color M&M's in their cup while filling in the chart on the worksheet. They will then calculate the total numbers and figure out how many of each color M&M there are in total by making a fraction (next chart). Once they have the fraction the are able to divide and have the number in the form of a decimal. Using the decimal they will multiply by 100 and find the percentage. This helps them develop the connection between fractions, decimals, and percentages. This activity can also be used to reinforce the process of calculating the mean, median, and mode. The students will construct the data in their tables the same way as above. But this time they will be calculating the mean, median, and mode instead of percentages. This is an engaging and enjoyable way for the students to practice their mean, median, and mode skills. After each of the activities, the students are provided with extra practice to ensure their understanding of the content. If you would like to view the full overview of the lesson and worksheet, click the links below.
Specifically in my activity, I will have the students break down into groups and explore the percentages of each color featured in a bag of M&Ms. Each group will be provided with one cup containing approximately 100 M&M's. In their groups, the students will count the total number of each color M&M's in their cup while filling in the chart on the worksheet. They will then calculate the total numbers and figure out how many of each color M&M there are in total by making a fraction (next chart). Once they have the fraction the are able to divide and have the number in the form of a decimal. Using the decimal they will multiply by 100 and find the percentage. This helps them develop the connection between fractions, decimals, and percentages. This activity can also be used to reinforce the process of calculating the mean, median, and mode. The students will construct the data in their tables the same way as above. But this time they will be calculating the mean, median, and mode instead of percentages. This is an engaging and enjoyable way for the students to practice their mean, median, and mode skills. After each of the activities, the students are provided with extra practice to ensure their understanding of the content. If you would like to view the full overview of the lesson and worksheet, click the links below.
| M&M's with Percentages and Mean, Median, Mode PowerPoint |
| M&M's with Percentages and Mean, Median, Mode |
